So you’ve built your lab, created a VM, and installed the Splunk package and you’re ready to start Finding Evil but you don’t know how? Never fear.
Let’s go over some Splunk basics. When data is indexed in Splunk, there are some basic default fields that are extracted: index, timestamp, sourcetype, and host. Using these fields in your search queries will greatly speed up your searches as Splunk uses this metadata to determine which datasets it needs to look through. It’s better to use as many of these fields as you can, but the two best fields to use if you can’t use all 4 are the index and time fields.
So let’s say you have your Palo Alto firewall syslogging traffic violations to your Splunk box, and you have Splunk set up to index that data into an index called “palo_alto”. Maybe you will call it “firewall”, it doesn’t matter all that much. I do like to keep similar logs together, but I have only one Palo Alto right now, so it goes into its own index. To specify which index to search, you specify on the search bar index=palo_alto
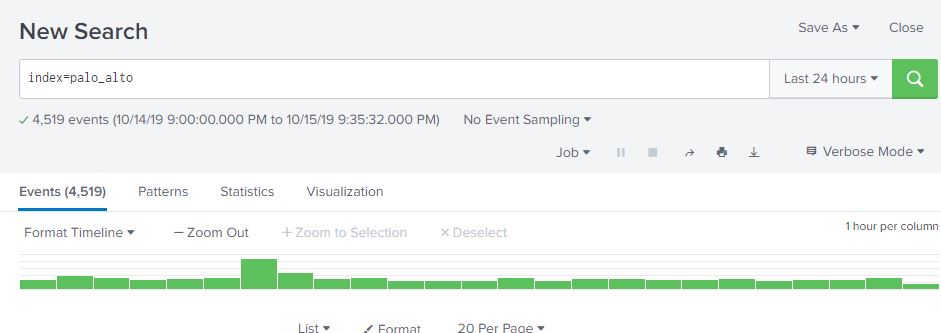
Splunk’s time picker defaults to the last 24 hours. This can be changed by either picking a new time range on the picker, or specifying an earliest and/or latest parameter in the search bar. For example, if we wanted to search for events in the palo_alto index going back 1 week, we can either select “Last 7 days” in the time picker, or add earliest=-1w (or -7d works as well). Making sure you are using the right time range is absolutely critical for getting relevant data from your searches, and for making them as efficient as possible. You may have the data, but it’s useless if it takes Splunk forever to return results!
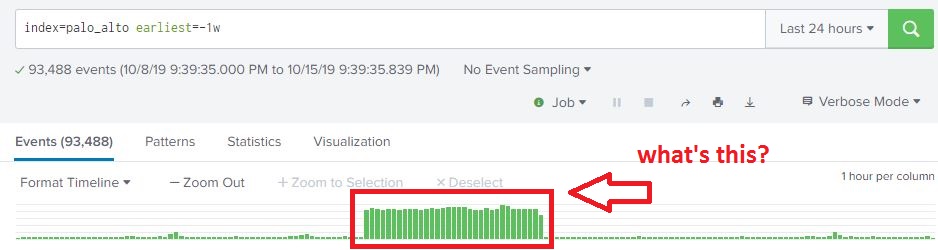
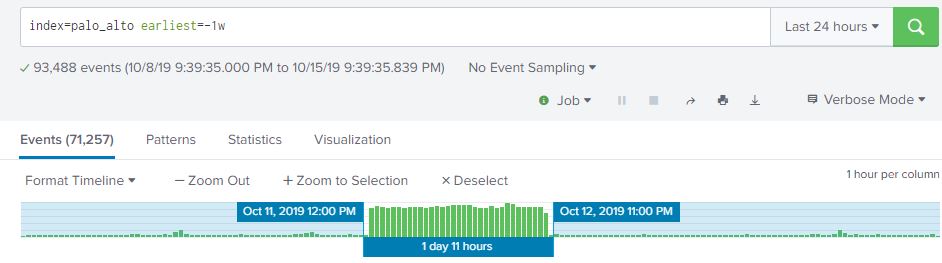
From what we can see here, there are over 93,000 events my firewall logged over the past week, and looks like there was a big jump in the middle of the week. This is interesting, let’s dig into this and see what’s going on. From here we can highlight the time range we are interested in by selecting the time range on the timeline that contains our spike in traffic. The event count drops from 93,488 to 71,257. This is a pretty significant jump in traffic!
Is this a single IP address scanning me, or several? If you have the CIM module installed in Splunk (highly recommended), this will make life a lot easier as it will perform extractions on your data and use standardized field names that you can search on regardless of what platform generated the data. For example, my Palo Alto doesn’t even label the fields in the log, it’s sent via syslog as a long comma separated string. The CIM module will apply standard fieldnames for these values such as dest_ip, dest_port, src_ip and src_port. Another platorm may log with fieldnames like dst_address, dst_port, s_addr and s_prt. The CIM module will add the standardized fieldnames at search time so you only have to worry about src_ip and src_port and not having to remember 20 different logging formats.
So… using standardized field names, let’s see if this is the work of one address or multiple scanners. One way we can do that is do a count for each IP address seen in this time range. If it’s a single address, we’re going to see a pretty high count. Building on our existing search and selected timerange from the timeline, we will send our 71,000 events and pipe them to the stats command. We want the count the number of times each source IP address appears in the log, so we will use the |stats count(src_ip) parameter. That’s pipe in front of the stats command, we are piping the output of the original search to this command much like we pipe the output of a Linux CLI command to another command. But we also want the source IP address to appear in the results along with the count, so we use |stats count(src_ip) by src_ip. This command will return a two column table with src_ip as one column with the source IP address, and count(src_ip) which is the count for that IP address. The command gives us a count starting from least to most, but we want to see most to least, so we need to SORT the results descending. In Splunk, we do this by piping the results of the previous command (the stats count) to the sort command and tell it to sort ascending(+) or descending(-) and which field to sort on. Since we are only returning src_ip and count(src_ip), we want to sort on the count. The command is |sort -count(src_ip)
The entire command to search is:
index=palo_alto earliest=-1w| stats count(src_ip) by src_ip|sort -count(src_ip)
Which results in:
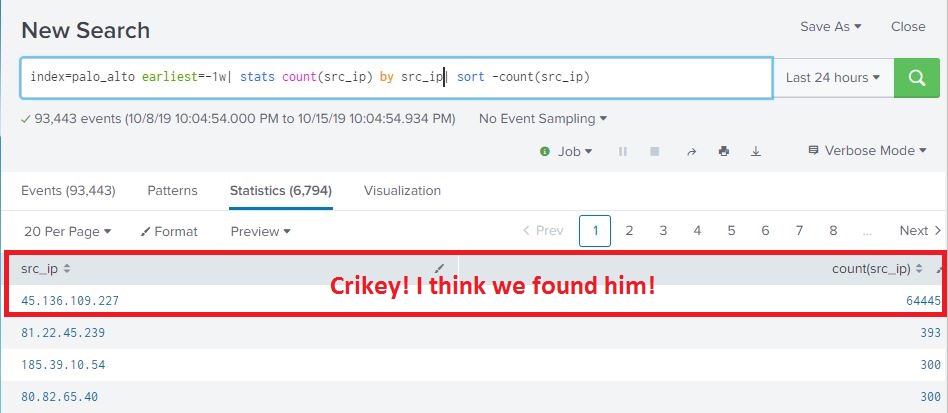
So during the selected time, we have one IP address that is responsible for 64445 log events from my firewall. The next highest address is only 393 for the same time period, so I think we found our guy. So now that we have our offender, we can go off and so all our cyber threat intelligence and analysis and do WHOIS lookups, maybe query a few threat feeds, etc… I’ll cut to the end- this address is associated with ciarmy aka CINS Army, etc…
But is our Russian friend just portscanning or is he looking for something in particular? Let’s do some Splunking to see if he’s hitting the same ports over and over, it if he’s doing a 1-and-done portscan. And since we have an IP address to pivot on, we’re going to use that in our search to narrow the results down a bit. What we’re looking for is src_ip=45.136.109.227 and count, by port, of every port that this guy hit. We also want to go from highest count to lowest count, so we’re going to sort again:
index=palo_alto earliest=-1w src_ip=45.136.109.227| stats count(dest_port) by dest_port| sort -count(dest_port)
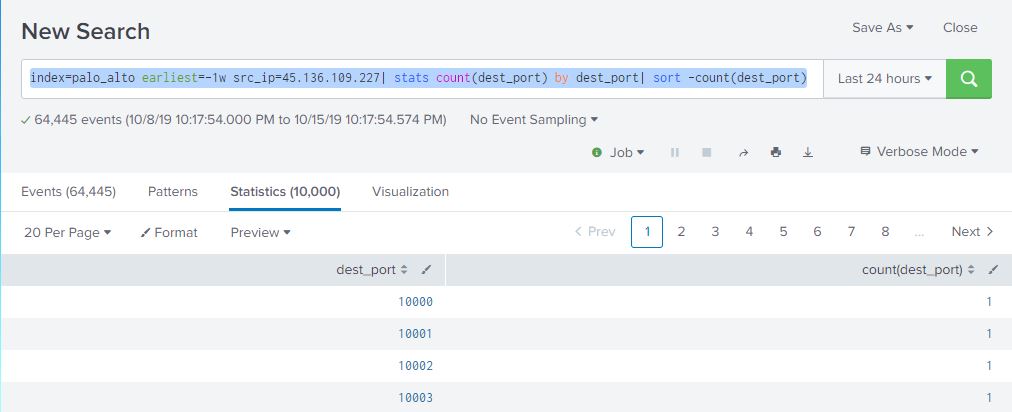
We’re seeing one hit per port, and it looks like it’s a sequential portscan. Let’s see if he was looking for any privileged ports such as ssh, telnet, etc… so instead of sorting descending by count, we’re going to sort ascending by dest_port.
index=palo_alto earliest=-1w src_ip=45.136.109.227| stats count(dest_port) by dest_port| sort +dest_port
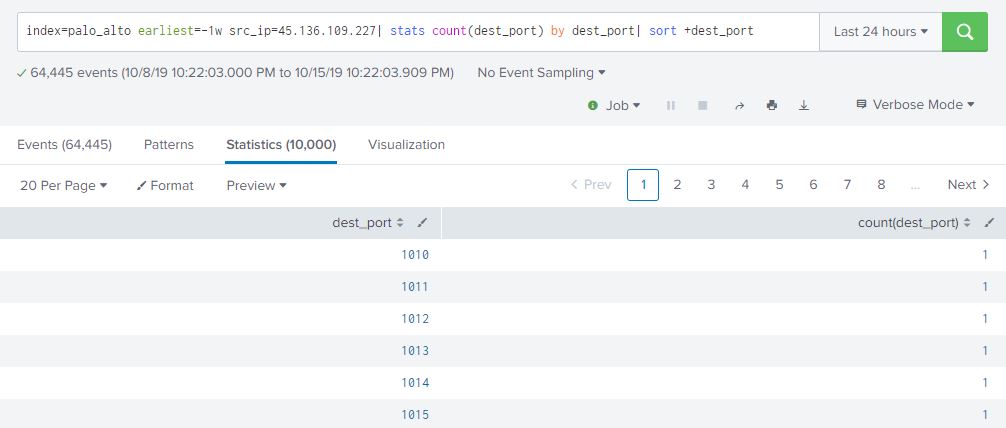
Our Russian pal started at port 1010 and ended (if you scroll through all the results or re-run the query and sort descending by dest_port) at port 65500. Sort of interesting that he started at 1010 instead of 1025 and ended at 65500 instead of 65535. Maybe something to add to our threat intel base for TTPs….